Observability
Observability over your librarian is important when you are running lots of background transfers, or when you have lots of data.
The librarian provides some basic observability tools through the python and command-line clients. However, there are three main outlets from the system that are useful for finding errors and for tracking progress.
Server logs
The librarian typically posts a lot of information about incoming web requests and responses to its logs. You can capture these using any method you are comfortable with.
Slack
The librarian can post to a slack webhook when it encounters errors. This web-hook can be configured using the following variables in the server settings JSON:
slack_webhook_enable: a boolean switch.slack_webhook_url_file: the file containing your webhook URL.slack_webhook_post_error_severity: a list of error severities that are sent to slack. By default, all.slack_webhook_post_error_category: Which error categories to post to slack. By default, all errors are sent.
Slack webhooks look like this:
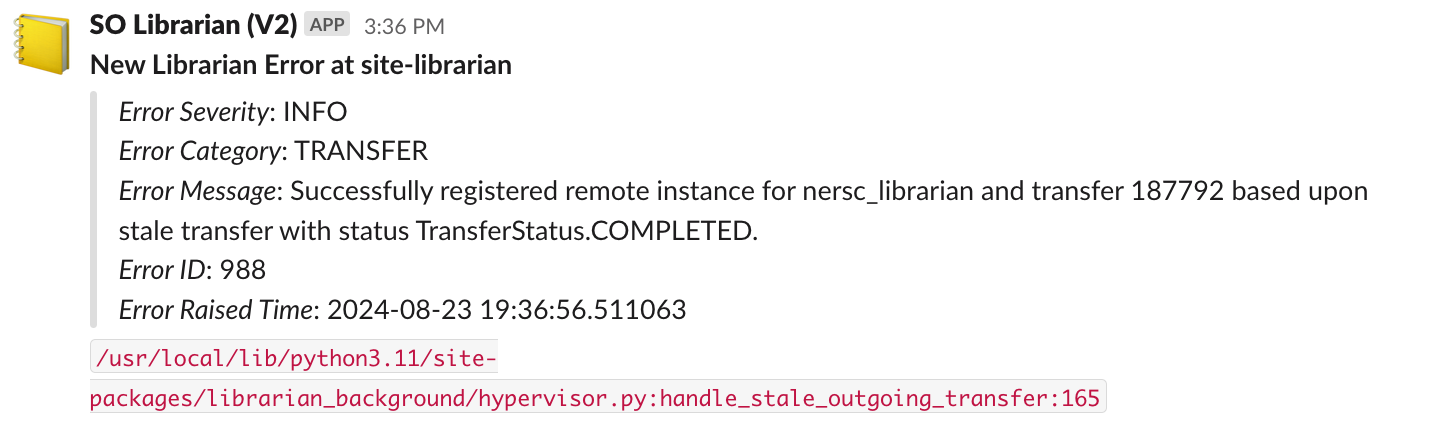
They include a reference to the code file that raised the error, so that it can be investigated if necessary.
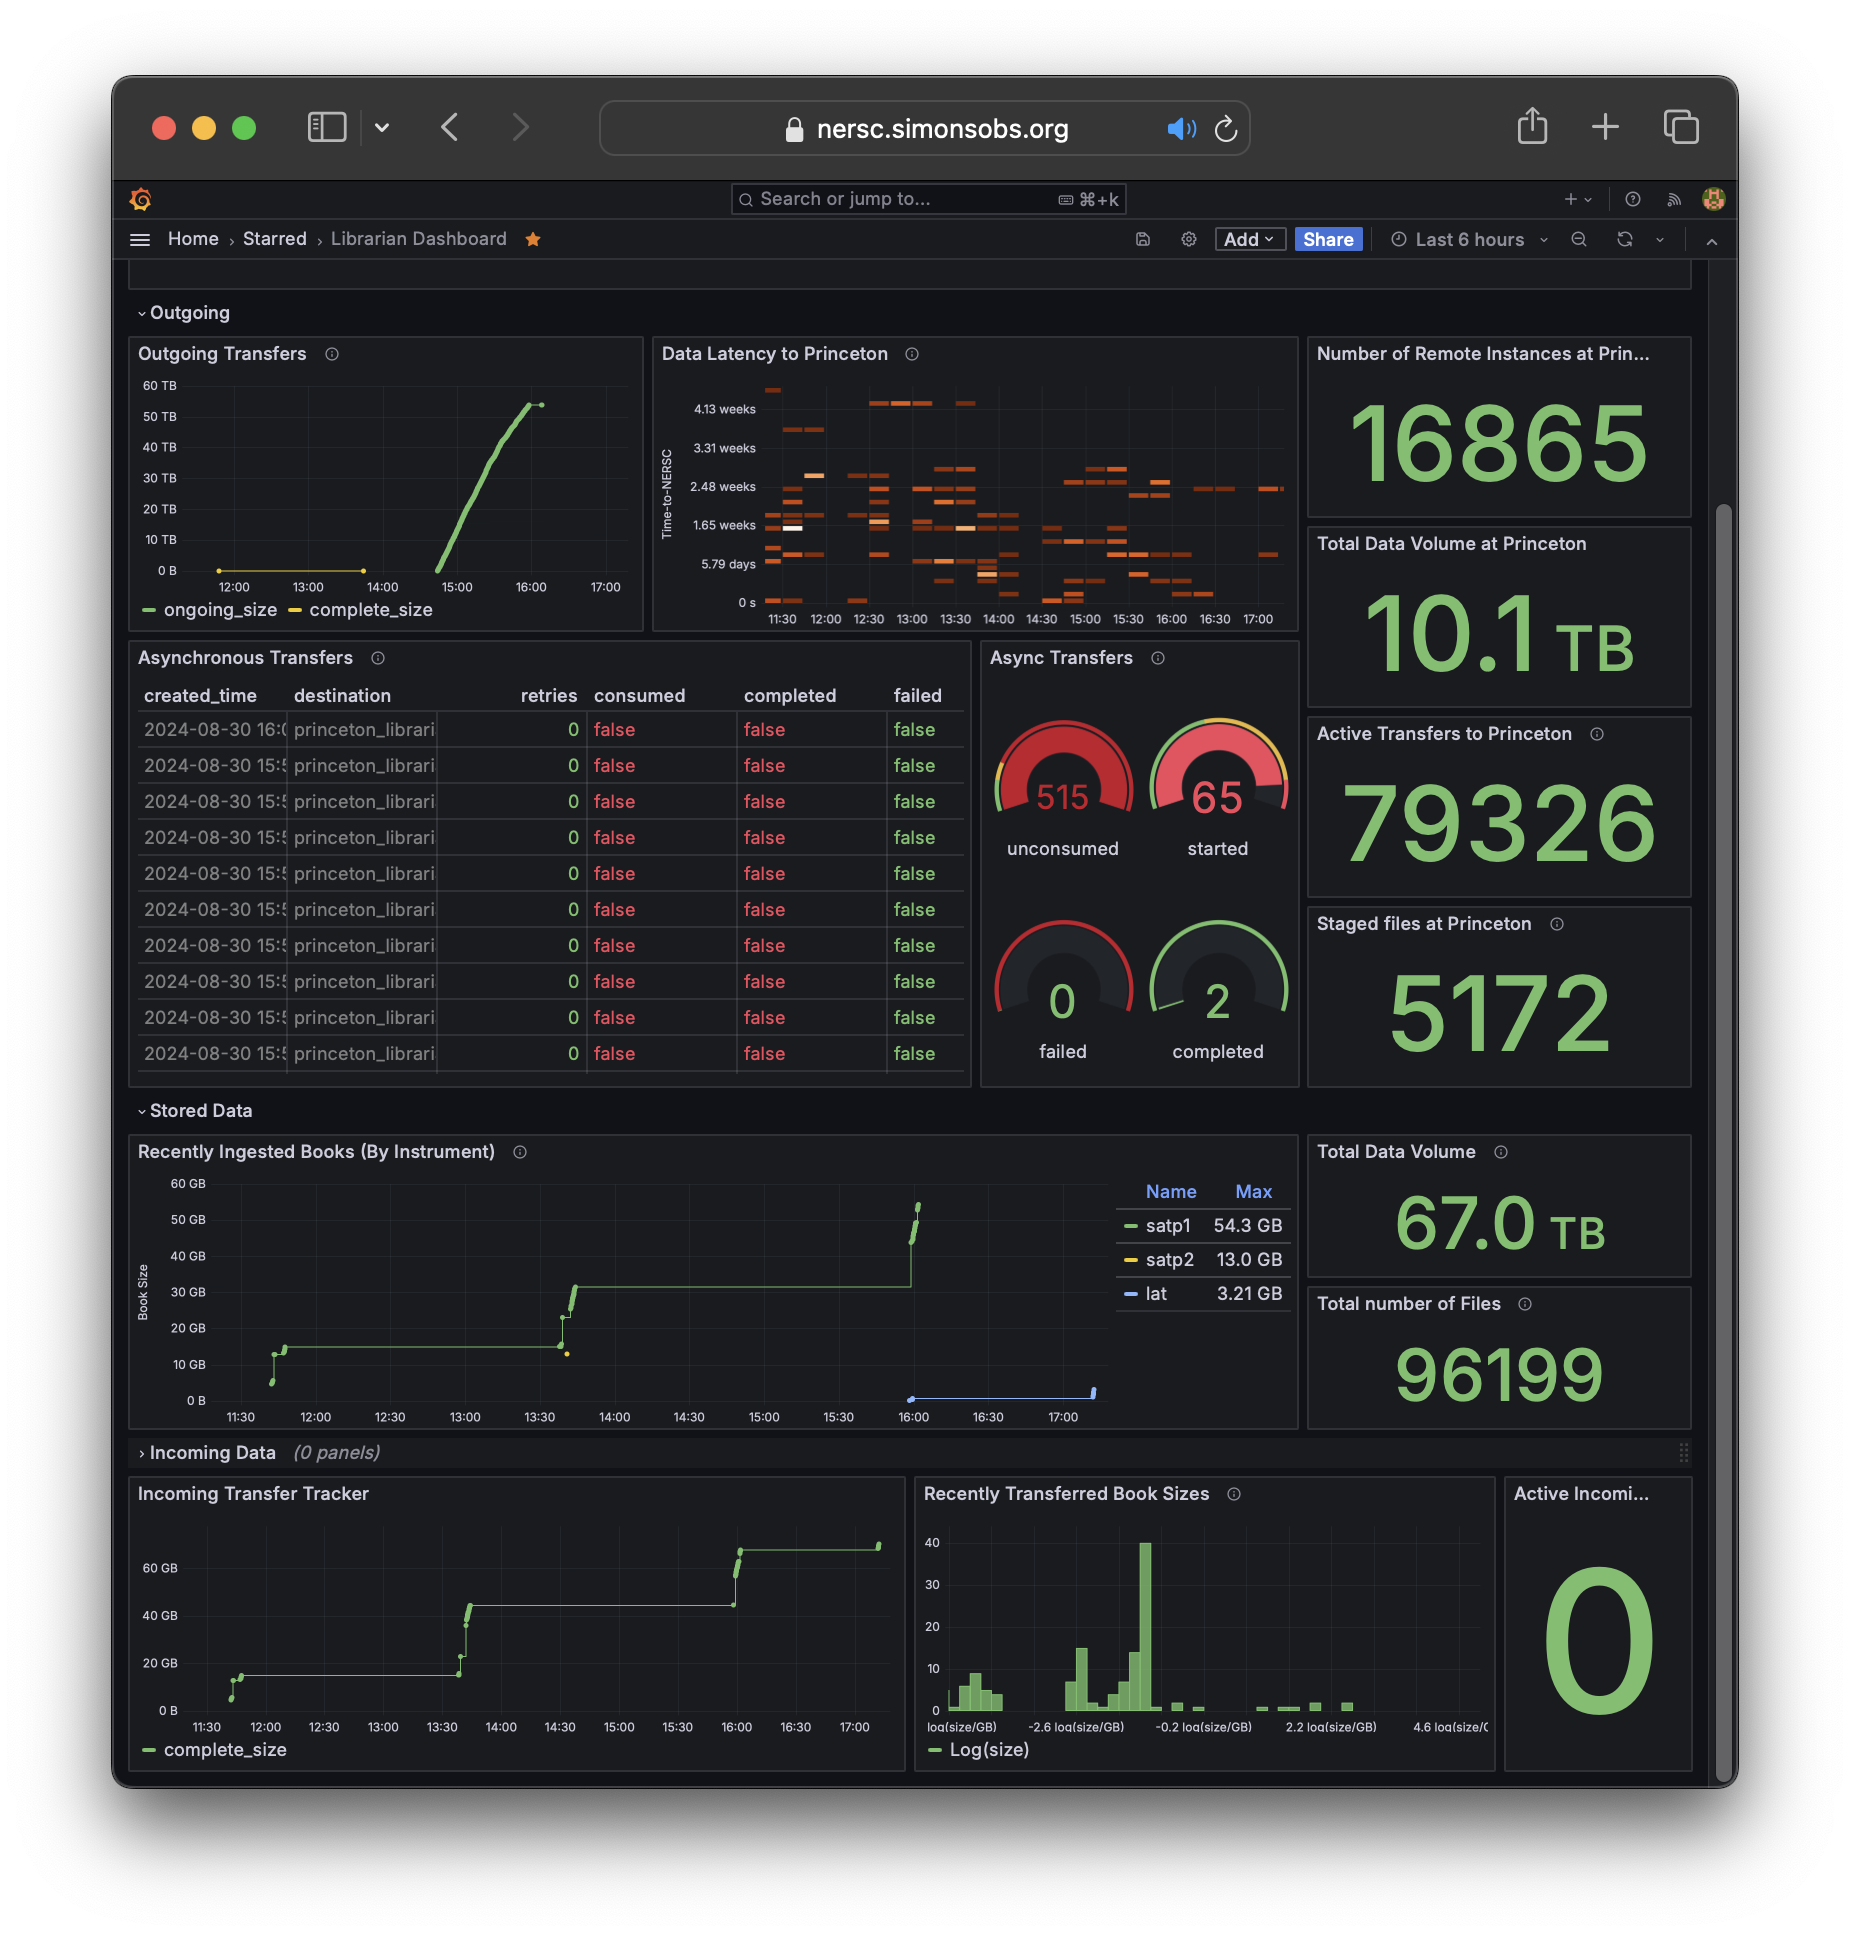
Dashboards (Grafana)
It is easy to build dashboards for the librarian. We do not provide a default dashboard setup because all librarian setups are unique, with unique network topologies. These are enabled through direct access of the librarian database with a SELECT-only account.
The librarian-server-setup script allows you to create a new role
and account on the database specifically for dashboard applications:
This creates a new account with the username grafana and a password that is printed to the screen. You can use this with the postgresql data source in Grafana (or wherever you want to create your dashboard) to directly query the librarian database for information about your files, transfers, instances, remote instances, and more.